Link to the service
Logo
Detailed description of the service
SciMesh represents scientific insights as a knowledge graph. In its current realisation, it focuses on sample-based workflows, in which samples (physical ones or data artefacts) undergo a sequence of processing and measurement steps. However, it is not limited to that. Most generally, it represents scientific insight by declaring a relationship between cause and effect. In other words, if certain prerequisites are set, then certain observations will be made. We think that this model is suitable for most of empirical science.
SciMesh graphs can be used for the publication of research output. Its prototypical implementation, however, targets at seamless data exchange between electronic lab notebooks (ELN). Another possible application is reliable timestamping of research in a blockchain.
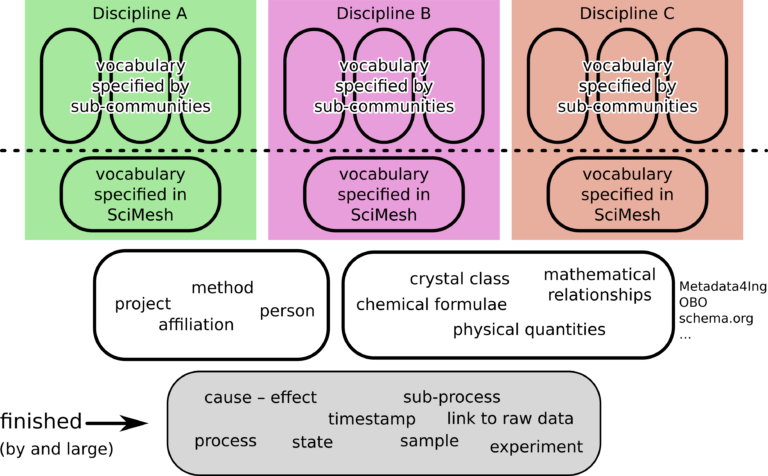
SciMesh’s core vocabulary is not much more than a handful of terms. Of course, this is not enough to tag scientific workflows and results in a meaningful way. The ontology_stack shows how the vocabulary problem is tackled in SciMesh. At the bottom, there is the core vocabulary. On top of that, we re-use subsets of existing vocabularies for basic scientific concepts as well as basic bibliographic concepts. At this level, SciMesh is already capable of providing graphs that can be indexed by search engines and used by scientists to find relevant other work.
However, SciMesh also supports the day-to-day business in science by allowing arbitrary, fine-grained vocabulary to be added to the graphs. These vocabularies, however, will only partly be specified by SciMesh itself in order to assure interoperability. Above the dashed line, highly specialized vocabulary allows for as much detail in the graph data as the scientist needs. It is defined by the community, or the institute, or the scientists themselves. This way, we hit the sweet-spot between interoperability and flexibility.
Let’s have a look at some details of SciMesh’s inner workings.
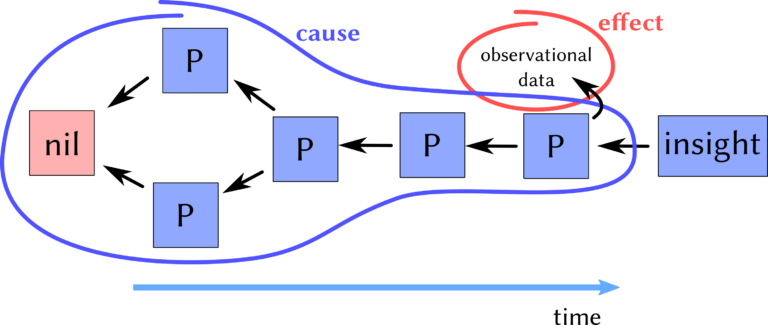
The cause_effect shows a graph illustrating SciMesh’s line of thought. Starting from an initial state called “nil”, processes “P” change this state. There is a monotonic increase in time from left to right. Consequently, this time axis also is inherent in a chain of processes. A process may be “take wafer substrate out of rack”, “heat the sample”, “mix two substances together”, or “wait for solar eclipse”. It is really that general. Every process has got one or more causes. Conversely, one process may be the cause of multiple others.
The compound_process is a representation of a compound process, or super process. Examples are multiple experiments in the very same vacuum, or heating of many samples in the same oven process. Each sample has only sample-specific process data in its direct graph (P2,4, here only the position in the apparatus, e. g. the oven). These sample-specific processes have a common predecessor C0 which contains all process details (temperature, heating time etc).
Terms of use & restrictions
SciMesh does not have any deployment somewhere. It is a specification – or format – that everyone can implement. NFDI4Ing creates reference implementations in three ELN software packages, namely JuliaBase, eLabFTW, and Kadi4Mat.
Contact
Torsten Bronger, t.bronger@fz-juelich.de
References
publications that reference (or report on using) the service
SciMesh web page, https://scimesh.org
SciMesh specification, https://scimesh.org/about/SciMesh.pdf
#WhyNFDI
To help electronic lab notebooks to span a global mesh, enabling close collaboration in day-to-day business.
Scientists can express their results and insights in detailed SciMesh graphs, timestamping them to prove their authorship, and publishing them for re-use by others.
SciMesh graphs are fully processable by machines, making workflows and methods accessible to machine learning.
Miscellaneous


