Link to the service
Detailed description of the service
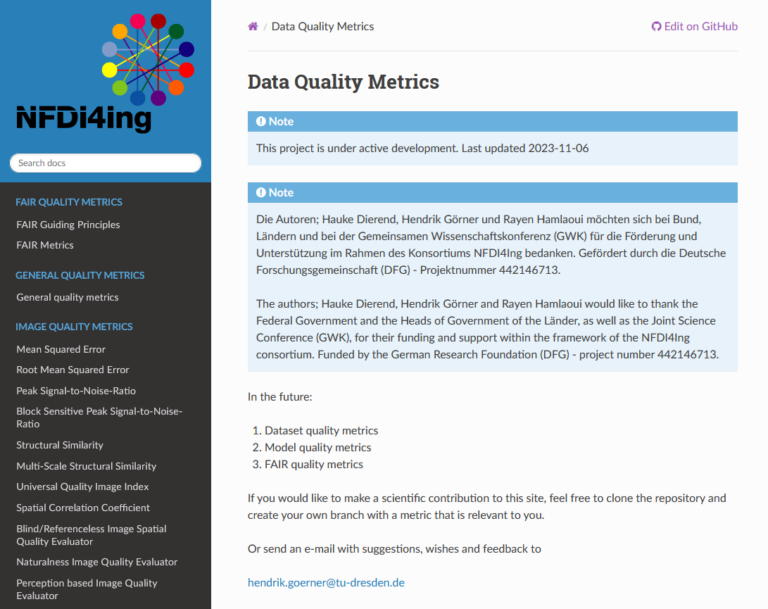
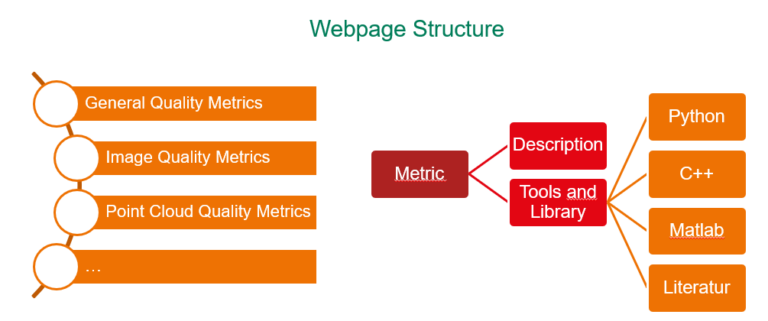
The service provides extensive capabilities, offering detailed explanations of the FAIR Guiding Principles—Findable, Accessible, Interoperable, and Reusable. It explores each principle in depth, offering multiple interpretations to help users apply them in various data management contexts. Additionally, it includes a section on general data quality, addressing critical dimensions such as Completeness, Accuracy, Consistency, Timeliness, and Reliability, with practical examples for application. For image quality, the platform focuses on key metrics like Mean Squared Error (MSE) and Peak Signal-to-Noise Ratio (PSNR), valuable for digital imaging and computer vision users. These concepts are explained through examples and code snippets, making them easier to understand and implement. The platform also covers machine learning metrics, especially in computer vision, including Accuracy, F1-Score, and Confusion Matrix, with practical guidance on using these to evaluate and improve models.
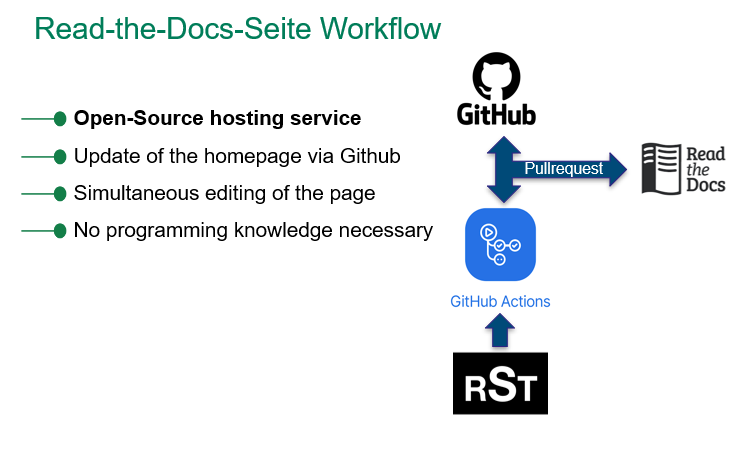
The platform’s value lies in its accessibility, practicality, and comprehensive coverage. It includes visual aids, code snippets, and examples that enhance learning and allow users to apply theoretical concepts directly in their projects. It serves as a comprehensive reference for a wide range of data-related topics, suitable for both beginners and experts. The integration with GitHub encourages community participation, allowing continuous content updates, while the use of reStructuredText simplifies editing, enabling even those with limited technical skills to contribute.
The service is ideal for data scientists, analysts, and machine learning practitioners working with large datasets, offering tools and methods to evaluate and improve data quality. Researchers, academics, and IT professionals can also use it as a comprehensive guide to support their work and implement best practices. Typical use cases include evaluating dataset quality, applying FAIR principles, and training models in computer vision. Users might refer to the platform for guidance on data quality metrics like completeness and consistency, or to understand and implement machine learning metrics effectively. Educators can also use it as a teaching tool, providing students with practical examples for understanding data quality and machine learning metrics.
The service’s strengths include its comprehensive topic coverage, practical focus, and community-driven approach. The platform breaks down complex concepts with examples, code, and visual aids, making information accessible. Its open-source nature and GitHub integration support continuous updates, ensuring content remains accurate. The reStructuredText format further lowers technical barriers for contributors. However, reliance on community contributions means the platform risks becoming outdated if engagement decreases. Additionally, using GitHub and reStructuredText, while simplified, may still present a barrier for those less familiar with these tools.

Terms of use & restrictions
Contact
Hendrik Görner, hendrik.goerner@tu-dresden.de
References
publications that reference (or report on using) the service
#WhyNFDI
The “Data Quality Metrics Wiki” is an accessible, community-driven platform that provides comprehensive resources on data quality, FAIR principles, and machine learning metrics. Built on ReadTheDocs and GitHub, it allows decentralized contributions, making it easy to update and expand. With practical code snippets, visual aids, and examples, users – from data scientists to educators – can apply concepts directly in their projects. It’s a valuable tool for evaluating data quality, optimizing machine learning models, and teaching data management.
Miscellaneous
Instruction to rSt
https://www.sphinx-doc.org/en/master/usage/restructuredtext/basics.html
Instruction read-the-Docs
https://docs.readthedocs.io/en/stable/tutorial/index.html
Instruction Github
https://docs.github.com/en/get-started/start-your-journey/hello-world
GitHub-Repository
https://github.com/NFDI4ING-TA-GOLO/GOLO_Data_Quality_Metrics

