Field experiments such as testing driver assistance systems in road traffic, submarine robots in open water, and traffic monitoring in cities mostly take place under difficult conditions. Due to the large number of sensors and computers, large amounts of data are usually generated, and data acquisition can be affected by small errors or external events. For further processing and analysis of field data, verification of data quality is essential. In doing so, researchers are often left to their own expertise. To provide researchers with a better overview, TA Golo has documented a website – the Data Quality Metrics Website.
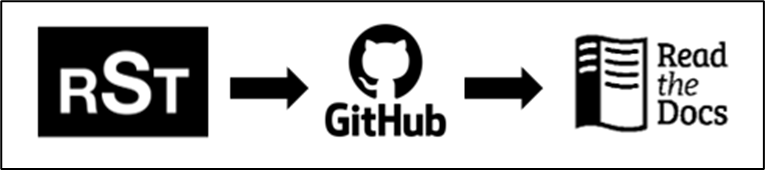
The diagram above shows the technical process from creating and updating the code mapping as a website. The source code is made available via the software management service Github for better versioning and decentralized development. For simplicity, text modules are organized in RST format, which offers the advantage of being easily translated into HTML code. New information as well as current changes can thus be easily added and transferred to the source hosting platform Read-the-Docs via a pull request.
The content of the website refers, among other things, to metrics that describe the quality of large data sets. For instance, the completeness of a data set or the lack of redundancy of individual entries can be mentioned here. Furthermore, quality metrics of images and point clouds are also described in this website. All in all, the website is to be understood as a documentation which, additionally also contains sample data sets and code snippets that can be used in a script and, in particular, adapted to one’s own research data.
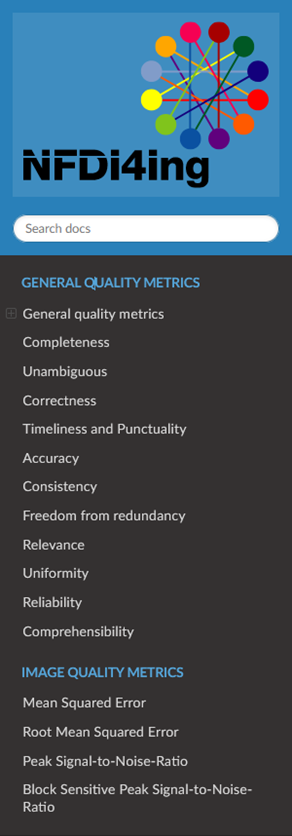
Various requirements were placed on the structure of the page. The structure should be clear and certain search terms and metrics should be immediately findable. Likewise, a simple and unlimited expandability should be guaranteed. As shown in the picture to the left, the page first presents the general quality metrics and then moves more specifically into the image quality metrics and so on. Each quality metric begins with a description as well as useful tools and programming libraries that are needed to determine it, and also an example calculation.
The examples are based on freely available datasets that are linked on the page to be recalculated if necessary. Each quality metric is determined by means of code in the form of a code snippet. This snippet can in turn be integrated into the user’s own research via a development environment. For better understanding, the code is sufficiently explained so that programming novices can use it.
Besides the quality metrics, the findability, accessibility, interoperability and reusability of data (known as the FAIR principles) can also be described quantitatively. For the future it is planned to implement these FAIR metrics.
The link to the page is: https://quality.nfdi4ing.de.
If you want to apply our services in your everyday research and help us to enhance research data management for field data, feel free to contact us at golo@nfdi4ing.de.